Welcome to the Year Eleven Fieldwork Photo Page
Updated for 2004: New Pictures, including satellite pictures of Porlock Bay and Minehaed. Plus, the class results in an excel file from trip one.
NOTE: This page contains quite large pictures so if you have a slow connection, wait for them to appear. To save images on this page, right click on them (mac ctrl+click) and copy them using copy from the drop down menu that appears.. Once you have done this you will be able to paste them into word and use them in your coursework.
TOP TIP: When using images in coursework, always make sure it is relevant, labelled, annotated or titled.
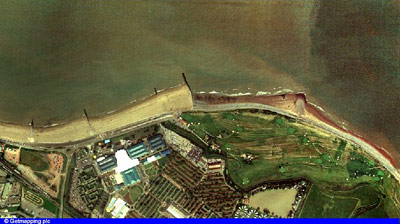
Above: Satellite Image of Minehead
|
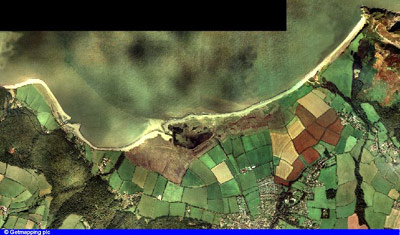
Above: Satelleite Image of Porlock Bay showing Gore Point (west) and Hurlstone Point (right) |
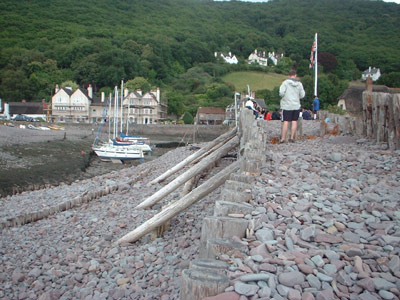
Above: The Terminal Groyne at Porlock Weir |
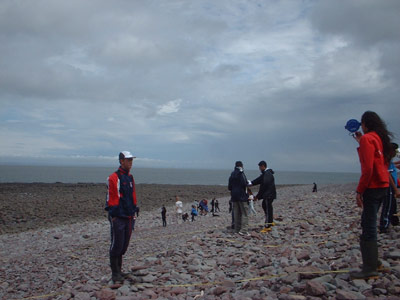
Above: Beach Profile measurements using clinometer and tape at a new facet. |
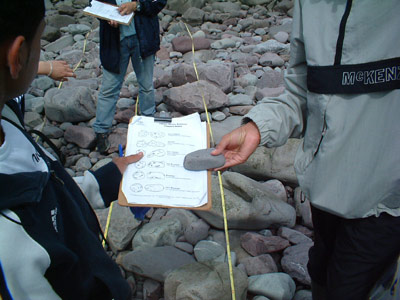
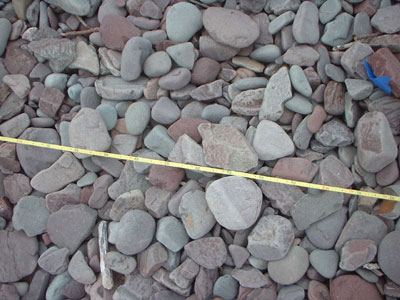
Above: Comparing a pebble on the Powers Index. |
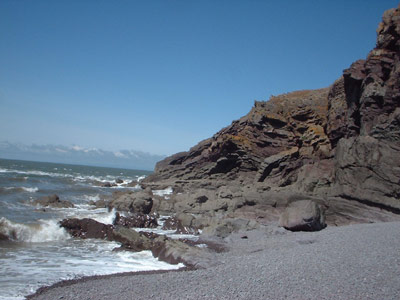
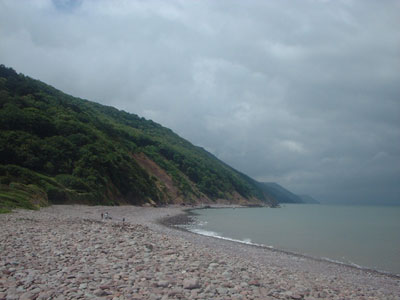
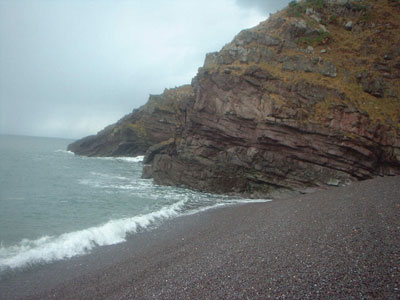
Above: Hurlstone Point - Hard, resistant Quartzite rock, which acts as a natural groyne at Hurlstoen point, preventing beach material from moving further east and explaining why the beach is so large at this point. |
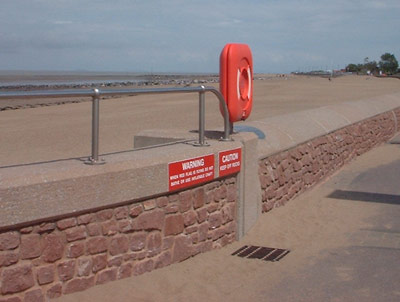
Above: Picture of Minehaed showing sea defences, rip rap armour (rocks in distance) and the newly renourished beach |
Above: Minehead Beach |
| |
| |
| |
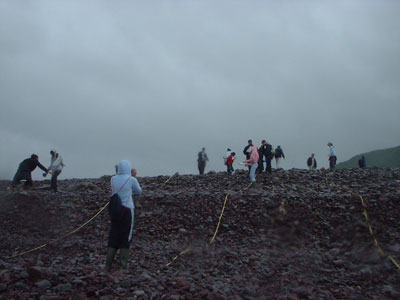
Above: More Beach profile measurements with a change in angle clearly seen
|
|
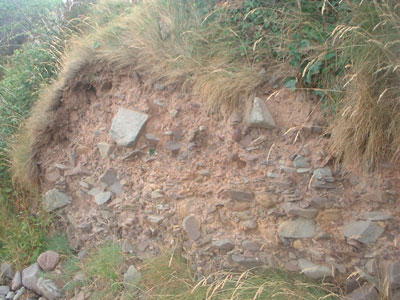
Above: Soft, Red Marl with sharp, angular rocks embedded within the Marl.
|
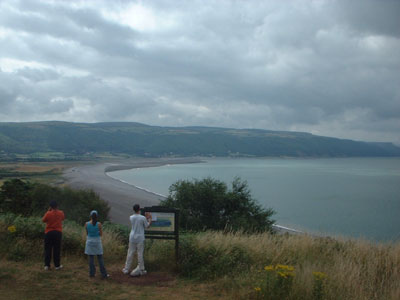
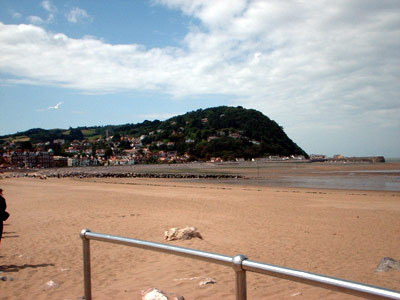
Above: View of Porlock Bay |
|
|
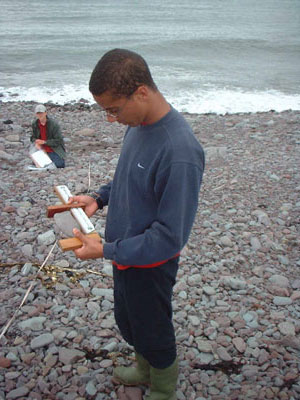
Above: Using the Pebbleomemter
|
|
|